Analytics · dashboards
Institut Cassiopée
GA4 + Looker
Tracking plan, funnel dashboards, and A/B test steering.
SYS/DATA
Set the KPI before the decoration.
Analytics is deciding what to measure before you measure. We set the KPIs, install a reliable GA4 tracking plan, then read the data — clear dashboards and extract analysis — so optimizations rest on numbers, not impressions.
Analytics is part of our Growth & Performance expertise — CRO, SEO, SEA and analytics.
SYS/FOR
Tools are plugged in, but no clear KPIs: nobody knows what actually counts. We reset the metrics before we measure.
Universal Analytics is dead. A poorly configured GA4 lies as much as it illuminates. We rebuild the tracking plan from the ground up.
An extract, a funnel, a decision to call. We go further than the tool: SRM, z-test, segments.
SYS/SCOPE
Six work streams — expand the one that applies to you.
Define the events and conversions that matter, named properly, before placing a single tag.
Triggers and variables in Google Tag Manager so every interaction is captured with no measurement gap.
Take the measurement history and port it into GA4 without losing comparability.
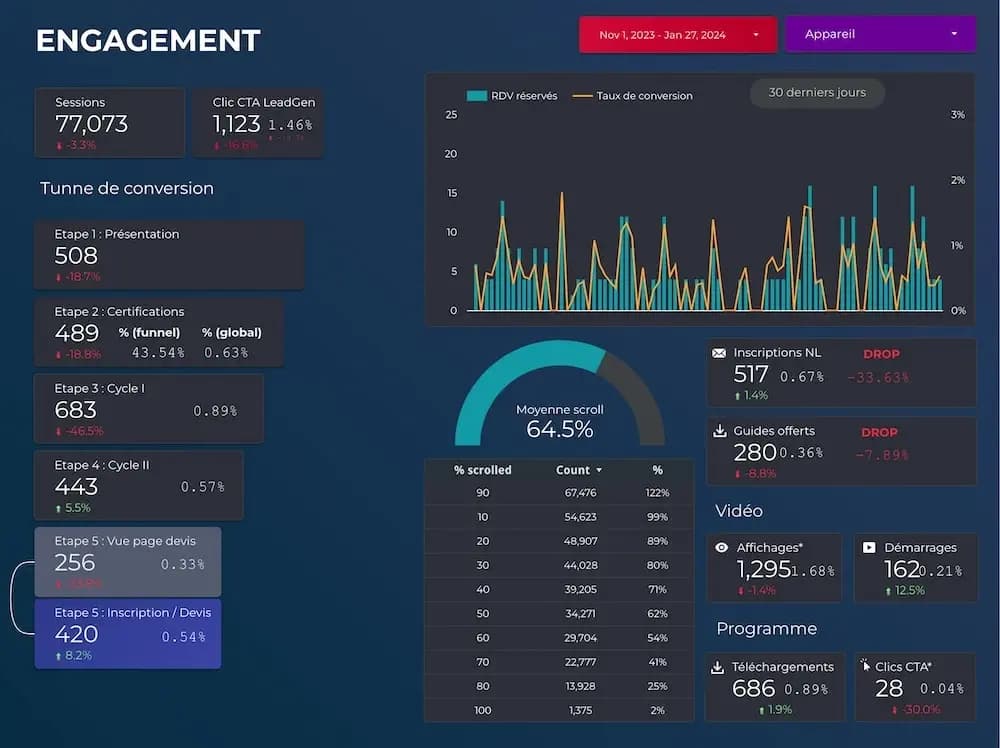
Readable dashboards, with Meta Ads connectors, so the data actually serves the decision.
Unique visitors, SRM, z-test and segments — the analysis goes further than the A/B tool.
Connect the web to the CRM to follow the journey from Lead to Enrolled, not just the clicks.
For the whole chain — form, qualification, routing, follow-up — see how to follow a lead all the way into the CRM.
SYS/AI
Three views of the same measurement: what it used to cost, what agents speed up, and what can't be delegated.
A tracking plan used to be written screen by screen in a spreadsheet, and analyzing an A/B extract took several weeks before yielding a recommendation.
Analysis was so expensive that we only ran it once, on the primary metric — segments got dropped.
A 214,473-row extract becomes 135,298 visitors, an SRM, a z-test and 29 segments in days — then an explorer the client can use. Analysis time drops from weeks to days.
The 29 segments exist because they cost almost nothing to produce: that's where the effects a global average hides actually live.
Instrumentation
The tracking plan is generated from the mockups, reviewed line by line, then pushed into GTM with no measurement gap.
Analysis
Extract → SQL/Python → explorer in days, with dashboard canvases generated then adjusted by hand.
Setting the KPIs is a decision, not a generation task: nobody but the team can say what matters to them. The decision stays human.
And it's a human who signs the recommendation — including when it amounts to saying do not ship.
SYS/LOOP
The studio's loop, on the data side.
SYS/PROOF
| Group | Summary-page rate |
|---|---|
| Control | 49.36% |
| Variant | 48.25% |
−2.25%, significant at over 99% · 214,473 extract rows → 135,298 visitors · SRM p = 0.18 · 29 segments. Recommendation: do not ship. The axis starts at zero and caps at 55% so two nearly equal bars stay that way on screen.
Analytics · dashboards
GA4 + Looker
Tracking plan, funnel dashboards, and A/B test steering.
SYS/TOOLS
SYS/FAQ
GA4 measures web behavior — pages, events, a few conversions. It often stops at the click. For a real decision (an A/B test, a CRM segment, a channel mix), we cross the export — BigQuery, CSV, SQL, Python — with what the business already knows.
The tool is a starting point, not the answer. A standard report that “looks good” can hide a hole-ridden tracking plan, duplicates, a poorly wired consent setup. We verify the data before we tell a story.
If GA4 is your only source and it's never been scoped, the first work stream isn't another dashboard: it's a reviewed tracking plan.
A Sample Ratio Mismatch: the actual split between variants A and B deviates from what was planned (50/50, 70/30…). It's a signal that the test is biased — redirect, bot, flicker, bad targeting.
We check it before interpreting any lift. A “+12%” in the A/B tool with an SRM isn't a winner: it's an artifact. The extract + a statistical test (z-test, etc.) exist for exactly that.
This is an example of what “analytics” means here: not a pie chart, a guardrail before shipping a variant to all traffic.
A dashboard (Looker Studio, often) tracks KPIs continuously: it steers. An analysis answers a precise question on an extract: it decides. Both are useful; mixing them up produces tables nobody reads, or slides with no follow-through.
We start with the question (“why did the quote rate break in March?”), then pick the tool. Not the other way around. A dashboard with thirty tiles isn't a measurement system; it's a screensaver.
Agents help clean an extract and produce views. They don't pick the question. That's the brief.
Universal Analytics no longer collects. The question is no longer “should we migrate”: it's “was the migration done properly?” Often not: poorly named events, ghost conversions, half-wired ecommerce.
Better to rebuild the tracking plan than trust hole-ridden data and compare “vs last year” that no longer exists. A broken history isn't a KPI.
We don't sell a magic “UA migration.” We sell reliable measurement from now on, documented, that CRO and SEA can actually use.
A primary KPI set before the test, a before / after (or an A/B run to power), an SRM check, documentation of the winner and the loser. Not a “we felt it was going better.”
Useful metrics: conversion rate of the target step, revenue or leads, sometimes micro-conversions (but they don't replace the KPI). A heatmap helps you see; it doesn't conclude.
The business detail is on the CRO page. Here, we hold the layer that makes those numbers believable.
For any team that wants stable events: marketing, product, data. A tracking plan written from the mockups (or live pages), names locked in once and for all, a GTM container reviewed line by line.
Without that, every new vendor adds a tag, a duplicate, a different “click - CTA.” Six months later, nobody knows what “generate_lead” means.
Agents can help inventory and document. Validating names and triggers stays human — and is often the real deliverable.
As soon as the real outcome isn't the click but the sale, the signed quote, the enrolled student. GA4 stops too early. A CRM export (even CSV) + a match is often where the growth program gets honest.
We don't need a CDP on day 1. We need an identifier, a date, a status. The studio works locally on the extract; nothing goes into a model without agreement.
If the CRM is chaos, we say so: measurement waits for a minimum of business hygiene, not the other way around.
No. Looker (or equivalent) is a monitoring screen. It makes the KPIs we chose visible. It doesn't ask the question, doesn't clean the extract, doesn't detect an SRM on its own.
A good dashboard has few tiles, one question per view, a date and a filter the business understands. A bad dashboard is a museum of charts. We build the first, we refuse the second.
Agents speed up the wiring and the queries. Reviewing the numbers — “could this actually be true?” — stays the job.
SYS/NEXT
Send us an extract, a GA4 account, or a measurement question: we'll tell you what's reliable, what isn't, and the first work stream. Written scope within 48h, no commitment.